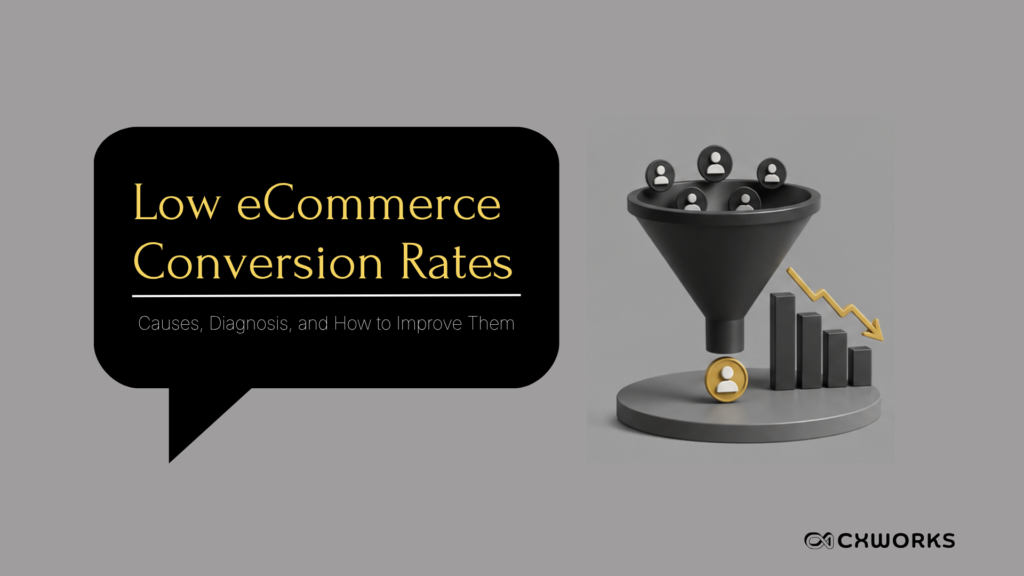
Low conversion rates create a measurable gap between eCommerce traffic and revenue. When visitors arrive but fail to purchase, the problem may involve traffic quality, product discovery, merchandising, website usability, pricing, checkout, or customer trust.
CXWorks approaches conversion performance as a connected digital customer experience issue. A headline conversion rate shows the outcome, but it does not explain the cause. Effective conversion rate diagnosis connects analytics, customer behavior, merchandising, user experience, and growth activity to identify where customers lose momentum. Broad eCommerce benchmarks provide context, but they do not define success. Industry data places many eCommerce conversion averages in the low single digits, while performance varies significantly by category, price point, device, traffic source, and purchase frequency.
What Is a Low eCommerce Conversion Rate?
A low eCommerce conversion rate occurs when an online store generates fewer completed purchases than expected from its traffic, customer intent, and commercial model.
The standard calculation is:
eCommerce conversion rate \= Completed orders ÷ Website sessions × 100
For example, an online store that receives 100,000 sessions and records 2,000 orders has a conversion rate of 2%.
A low website conversion rate cannot be judged from one industry average. A furniture retailer, a repeat-purchase beauty brand, and a B2B distributor operate under different purchase cycles. Product complexity, order value, customer familiarity, and buying frequency change the expected conversion pattern.
Conversion benchmarks also vary by device and channel. Paid social may introduce new audiences with limited purchase intent, while email traffic may include returning customers who already know the brand. A blended site-wide number can hide major differences between customer groups. The useful question is not, “Is our conversion rate below average?” The useful question is, “Which customer segment is underperforming, where does the journey break down, and what evidence explains the gap?”
What Causes Low eCommerce Conversion Rates?
Low eCommerce conversion rates usually result from several connected factors. Poor traffic quality creates an audience-intent mismatch. Campaigns may attract visitors who have limited interest in the product, while landing pages may fail to match the message, offer, or expectation established by the advertisement.
Weak navigation and site search create product discovery problems. Customers cannot purchase products they cannot find. Poor category structures, irrelevant search results, weak filters, and unavailable product recommendations reduce product engagement and increase exits. Product page conversion issues occur when pages fail to answer purchase questions. Product information must explain value, specifications, fit, compatibility, availability, delivery expectations, and return conditions. Images, reviews, and clear merchandising reduce uncertainty when they provide relevant evidence.
Pricing and promotion friction can also suppress purchase intent. Unexpected shipping costs, unclear discounts, inconsistent prices, and late delivery information create hesitation after customers have already invested time in the journey. Mobile experience issues reduce conversion when pages load slowly, controls are difficult to use, or product content does not support smaller screens. Mobile traffic often represents a large share of site visits, so poor mobile usability can lower the overall result even when desktop performance remains stable.
Checkout friction creates barriers after customers have demonstrated strong intent. Long forms, forced account creation, limited payment methods, technical errors, and unclear order totals can reduce checkout completion. Baymard Institute reports an average cart abandonment rate of 70.19%, although some abandonment reflects browsing and price comparison. Trust gaps also affect purchase decisions. Customers require reassurance about payment security, returns, delivery, product quality, customer support, and the credibility of the seller.
How to Diagnose Low eCommerce Conversion Rates
Conversion rate diagnosis should begin with the customer journey. A conversion funnel analysis identifies where customers leave the purchase path. The core funnel often includes landing-page sessions, product views, add-to-cart events, cart views, checkout starts, payment completion, and completed orders.
Each stage should be segmented by channel, device, audience, geography, customer type, and product category. A low online store conversion rate may result from poor mobile checkout performance, weak paid traffic, or low engagement with a specific product range. Site-wide averages can conceal these patterns.
Quantitative eCommerce analytics should be combined with behavioral evidence. GA4, GTM, and commerce-platform data identify performance changes, while session recordings, heatmaps, customer surveys, search analysis, and usability testing explain customer behavior. Teams should also separate traffic problems from experience problems. If qualified visitors reach product pages but show a low add-to-cart rate, product content, pricing, or merchandising may require investigation. If visitors abandon before meaningful engagement, the traffic source or landing-page relevance may represent the larger issue. An eCommerce conversion audit should produce evidence-based hypotheses.
Which eCommerce Metrics Explain Low Conversion Rates?
The headline conversion rate should operate as one metric within a broader measurement system. Funnel conversion rates identify where customer momentum declines. Product-view rates indicate whether landing pages generate product interest. Add-to-cart rates indicate whether products and offers create sufficient purchase intent.
Cart abandonment and checkout completion rates show whether customers encounter purchase journey friction after selecting products. A high cart abandonment rate does not automatically prove that checkout causes the problem, but it creates a clear area for further analysis. Revenue per visitor connects traffic and commercial performance. Average order value shows how much customers spend when they convert. Customer acquisition cost indicates how much the business spends to generate demand.
Customer lifetime value provides additional context. A change that increases first-order conversion but attracts low-value customers may not improve long-term commercial performance. Conversion rate analysis should also measure data quality. Missing purchase events, duplicated transactions, inconsistent consent behavior, and incorrect channel attribution can create misleading conclusions.
How to Improve Low eCommerce Conversion Rates
Businesses improve conversion rates by addressing validated customer barriers in priority order. Traffic quality improves when campaign targeting, search intent, audience definitions, and landing-page messages align. The landing page should continue the customer’s journey from the advertisement or search result instead of introducing a different proposition.
Navigation, search, and merchandising improve product discovery. Clear category structures, relevant filters, accurate search results, and useful recommendations help customers move from exploration to product evaluation. Product pages improve performance when they reduce uncertainty. Strong product content explains the product’s value and use case while providing accurate specifications, availability, delivery information, reviews, and return details.
Customer trust increases when reassurance appears at the point of decision. Payment information, delivery commitments, support access, and return policies should remain clear without overwhelming the page. Mobile and performance improvements reduce unnecessary effort. Teams should review page speed, interaction quality, content hierarchy, form usability, and mobile payment behavior using real customer data.
Checkout improvements should remove avoidable barriers. Guest checkout, appropriate payment options, clear costs, concise forms, and useful error handling can improve completion when evidence confirms that these issues affect customers. A/B testing for eCommerce should validate defined hypotheses. A test should specify the customer problem, proposed change, target audience, primary metric, guardrail metrics, and measurement period. Testing isolated visual changes without a behavioral hypothesis does not produce durable learning.
How to Prioritize eCommerce Conversion Improvements
Conversion opportunities should be prioritized by impact, evidence, effort, and risk. An ICE-style scoring model can estimate expected impact and implementation effort, but evidence quality should receive equal weight. A change supported by funnel data, session recordings, usability findings, and customer feedback deserves more confidence than an idea based only on opinion.
A conversion optimization strategy should organize improvements into a roadmap. The roadmap should distinguish quick operational fixes from larger work involving platform technology, analytics, merchandising processes, or customer experience design. Teams should measure incremental impact beyond the headline conversion rate. Revenue per visitor, average order value, margin, repeat purchase behavior, and customer lifetime value provide a more complete view of commercial outcomes.
Common Mistakes When Addressing Low Conversion Rates
Businesses often change the website before identifying the problem. New layouts and redesigned pages can introduce additional friction while leaving the original conversion barriers unresolved. Industry benchmarks can also create false conclusions. A benchmark does not account for product value, customer maturity, device mix, acquisition strategy, or purchase cycle.
Page-level optimization can overlook the complete customer journey. A product page may perform well while customers encounter delivery uncertainty, account barriers, or payment issues later in the process. Teams also weaken experimentation when tests lack clear hypotheses or measurement controls. Changes to campaigns, pricing, inventory, seasonality, and website content can affect results during an experiment.
When Low Conversion Rates Indicate a Larger Digital Commerce Problem
Persistent eCommerce conversion rate problems may indicate operational disconnection. Analytics teams may measure customer behavior differently from marketing teams. Merchandising teams may lack visibility into search demand and product engagement. Technology teams may prioritize releases without a shared view of customer or commercial impact.
These gaps create inconsistent decisions across acquisition, experience, merchandising, analytics, and retention. Sustainable conversion growth requires a connected operating model. The business must connect customer data, performance measurement, experimentation, merchandising, technology, and growth activity around shared commercial outcomes.
CXWorks helps eCommerce businesses diagnose these connections and translate evidence into prioritized customer experience improvements. The objective is not to increase a metric in isolation, it is to create a more effective digital commerce system that supports customer decisions and measurable growth.
Frequently Asked Questions About Low eCommerce Conversion Rates
A low conversion rate is a rate that underperforms against the business’s category, traffic quality, device mix, customer behavior, and historical trend. Broad averages provide orientation, but a relevant segment benchmark provides a more useful comparison.
A declining conversion rate can result from changes in traffic quality, product availability, pricing, competition, website performance, customer behavior, or measurement. Funnel analysis should identify when the decline began and which segments changed.
Businesses improve a low eCommerce conversion rate by diagnosing customer barriers, prioritizing evidence-based improvements, and validating changes through controlled experimentation. Traffic relevance, product discovery, product content, trust, mobile usability, and checkout performance require coordinated review.
Teams should analyze funnel progression, product engagement, add-to-cart rate, cart abandonment, checkout completion, revenue per visitor, average order value, customer acquisition cost, and customer lifetime value.
The timeline depends on the cause and the required change. Analytics corrections and small usability issues may be resolved quickly, while platform limitations, merchandising processes, and customer journey problems may require a longer optimization roadmap.